Developing a strategy
Tsetse Plan now has all the basic data necessary to simulate the local population of tsetse. It now helps you explore what will happen if you start killing tsetse in particular areas with a given mortality.
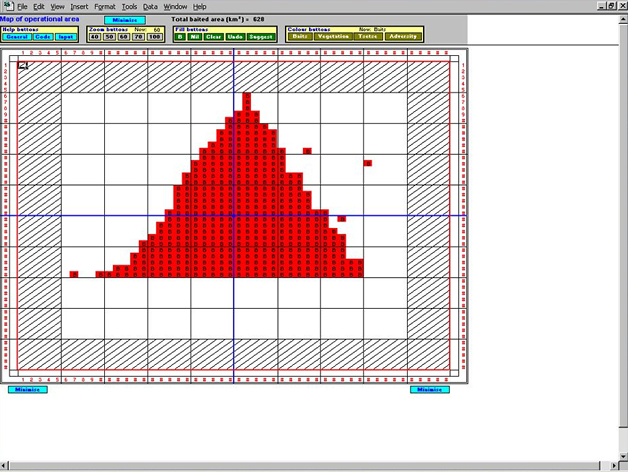
First, the programme asks you to select where you wish to kill tsetse by deploying baits. You can choose to deploy these baits wherever you wish. However, you might like to ask Tsetse Plan to suggest where the baits should be deployed. It uses the data you have provided to identify areas where baits would be particularly effective.
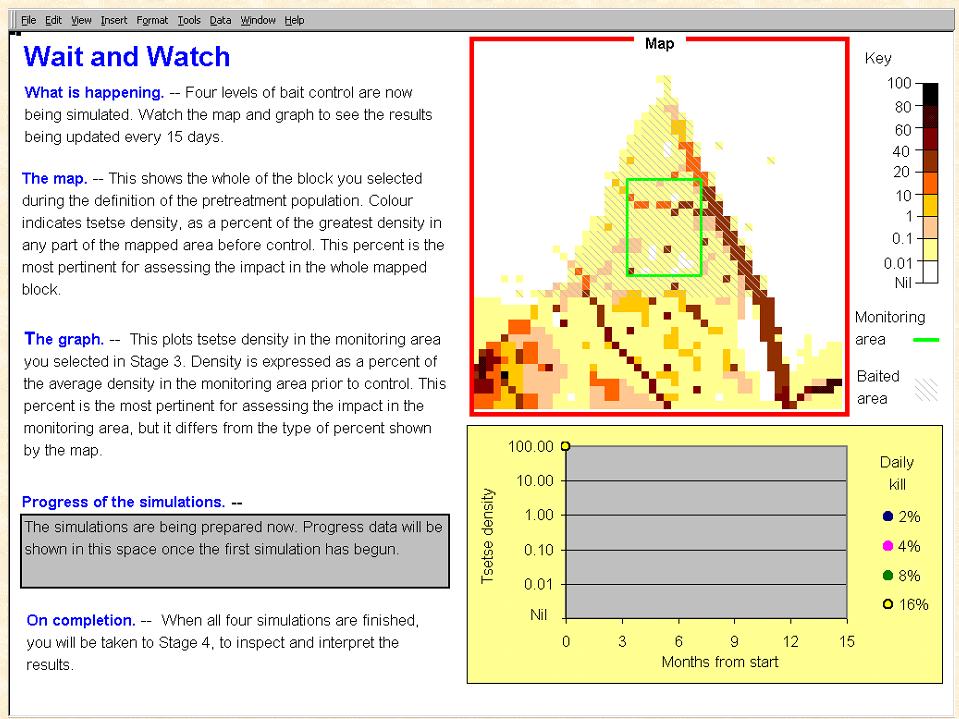
Next, the programme then asks you to select an area where you would like see the effect of the baits. Having selected the monitoring area, the programme then runs four simulations showing what would happen if you killed 2%, 4%, 8% or 16% of the tsetse population per day in areas where baits were deployed. This process can be rather time consuming, especially on older types of computer.
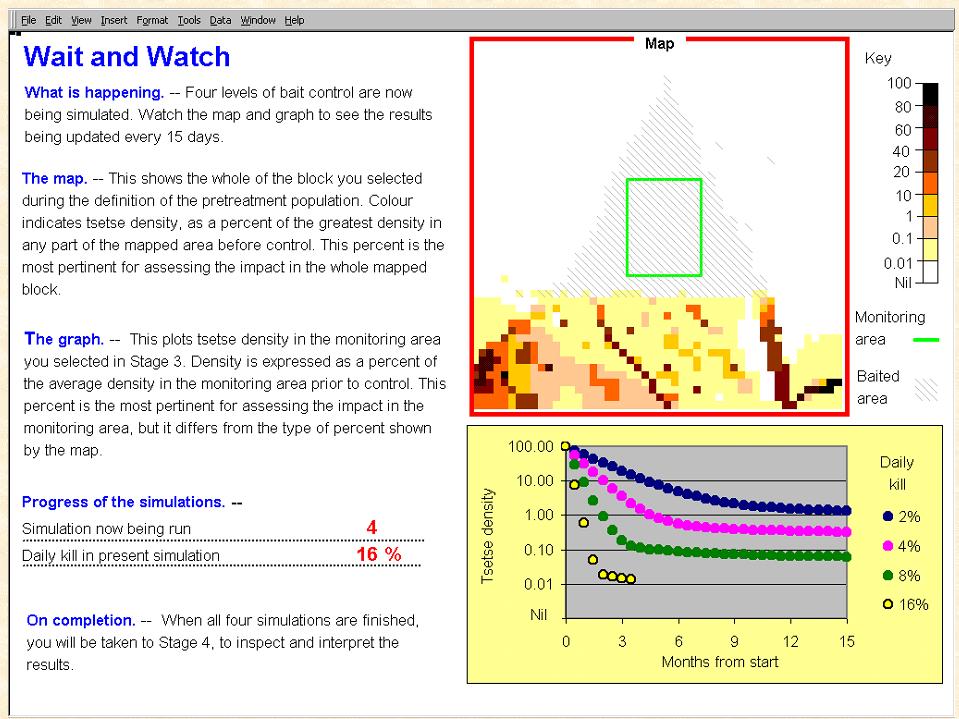
The output of the simulations is shown as both colour-coded changes in the density of tsetse over the entire operational area, and as a series of line graphs indicating what will happen in the monitoring area.
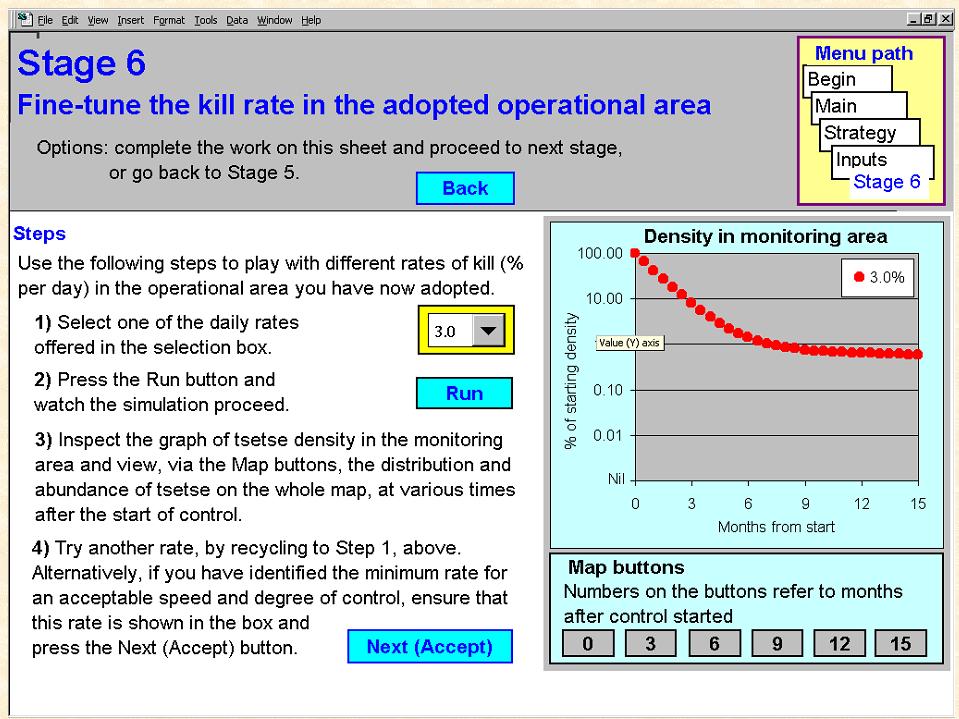
At the end of this process, you can look at the effects of the various levels of control (i.e. 2%, 4%, etc) and the rate that tsetse declined. From this you might decide that you want to have something slightly better than the effect produced by a 4% mortality but not necessarily as fast as 8%. The programme then lets you select any integer value of control between 1 and 16% and then you can then watch the effect on the tsetse population.